Allow Cookies ?
To enhance your browsing experience on our website, we utilize cookies. For more detailed information regarding our use of cookies, kindly refer to our privacy policy.
Allow Cookies
Allow Cookies ?
To enhance your browsing experience on our website, we utilize cookies. For more detailed information regarding our use of cookies, kindly refer to our privacy policy.
Allow Cookies
Traditional P&L statements often fail to answer key business questions: Which customers or projects drive growth? Where are inefficiencies? Are resources being optimized? Addressing these gaps requires granular, actionable insights that link financial performance to strategic decision-making.
This article builds on our previous discussions on Customer & Project Profitability and project profitability and responsibility P&L, focusing on P&L Metrics and Operational KPIs. We explore their computing logic, interdependencies, and practical interpretation to drive better business outcomes. If you haven’t read the earlier articles, we recommend doing so for a comprehensive understanding.
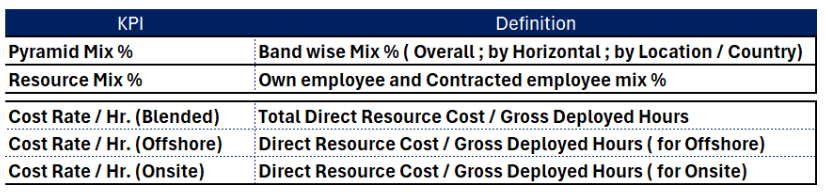
Offshore & Onsite Rates: Measured separately for better cost-profitability insights.
Better Granularity : IT companies segment bill rates by employee band, contract type, and location ( offshore/ Onsite or by country) using an allocation principle consistently for deeper analysis, while some companies choose not to split the same and review it at blended level. Both approaches are common in the industry, depending on leadership priorities and the focus on specific metrics for decision-making and acceptance of allocation principles.
Key Insight: A declining bill rate signals a need for strategic review—whether due to specific customers, markets, or overall trends.
Suppose offshore entry-level rates start at $18/hour, then with incremental increases of $1–$3/hour will get added for subsequent higher bands. 75–85% of billing falls within the first three entry bands, making pricing crucial. Blended pricing can be a trap if resource levels are not controlled. Tiered pricing is recommended in case of T&M contracts.
Measures employee productivity. If there is a significantly higher revenue per employee compared to peers, it often indicates non-linear revenue growth or sales from system integration deals.
Revenue Mix (offshore vs. onsite) can influence the Revenue per employee.
Key Insight: One-time sales can distort this metric; ensure revenue sources are analysed before drawing any inference.
Segment revenue by Vertical, Horizontal, and Geo-region to track performance trends.
Analyse Project Type (Onsite-Offshore Mix) & Contract Type (T&M, Fixed Price, SaaS, etc.) for margin consistency.
Key Insight: Sudden metric distortions due to new deals require proactive mitigation to protect overall profitability.
Note: For T&M contracts, revenue is naturally split by Offshore and Onsite resources, but for non-T&M models, there’s often no predefined mechanism. Some companies apply a consistent allocation logic, while others ignore the split, limiting granularity and requiring KPI analysis at the overall project level.
Delivery teams should maintain a strong bottom-pyramid structure to control costs.
Pyramid mix should be analysed at company level, horizontal level, and by geography.
Direct resource cost should include all resources if using Gross Deployed hours as the denominator. If using Project Deployed hours, only project-specific direct resource costs should be considered.
Customer-level profitability analysis is crucial for strategic pricing and contract decisions and above data table preparation hinges on the same too.
In our previous discussion on responsibility P&L, we emphasized tracking delivery and sales overheads across business units to prevent overspending. The same principle applies to General & Administrative (G&A) expenses, where functional leaders are accountable for managing their budgets within a range.
CFO oversees the Finance budget, covering salaries, travel, audit fees, legal and professional charges, payroll services, and sometimes CSR.
HR Head manages HR-related costs, including recruitment, training (non-delivery), campus hiring, employee engagement and talent management, and welfare activities.
Marketing Head handles expenses for salaries, travel, events, digital marketing, business development, and industry seminars.
IT Head is responsible for IT support, software licenses, infrastructure upgrades, cybersecurity, and data storage.
Administration Head supervises facility management, utilities, transportation, rent, and maintenance costs.
Each department owns its budget and must ensure optimal spending while aligning with business goals. These cost controls are key KPIs for financial discipline and operational efficiency.
Project Utilization = Billed Hours / Project Capacity (Total project deployed hours)
Gross Utilization = Billed Hours / Total Available Hours (Gross delivery available hours)
Focus on reducing utilization leakage through project effort optimization.
Key Insight: For external utilization reporting include leave hours as part of billed hours, but for internal tracking we segregate and analyse leave impact separately.
Measured on a Last 12 Months (LTM) basis for workforce stability insights.
Additional KPIs to Track - (Not exhaustive—refer to past articles for detailed coverage)
Revenue Mix Analysis: Categorized into Existing Revenue, New Business from Existing Customers, and New Customers to track growth sources. Bookings follow the same classification to assess sales momentum and customer expansion.
Deal Booking Trends
Days Sales Outstanding (DSO) – Billed & Unbilled
Receivables Aging Analysis
Facility Cost per Seat
Qualified Leads & Sales Pipeline
Win-Loss Ratio
Forecasting Accuracy
Order Book Future Coverage
Customer Churn (SaaS Models)

Answer a few questions and get matched with experts who’ve helped 500+ businesses like yours.
CEO Description
Here's a curated list of finance leaders for your industry and company size.
Finding your perfect CFO partners...


Our talented team will reach you out shortly.
Let's talk! Book your free consultation today