Allow Cookies ?
To enhance your browsing experience on our website, we utilize cookies. For more detailed information regarding our use of cookies, kindly refer to our privacy policy.
Allow Cookies
Allow Cookies ?
To enhance your browsing experience on our website, we utilize cookies. For more detailed information regarding our use of cookies, kindly refer to our privacy policy.
Allow Cookies


Posted On 2025-12-01
Author Sachin Gokhale
Most companies carry more SKUs than their data can clearly explain in financial terms. When the portfolio becomes crowded, it is harder to distinguish which Stock Keeping Unit SKUs genuinely drive revenue, which erode margins, and which quietly slow cash conversion. Product rationalization brings clarity to the portfolio. The moment low-performing SKUs are removed, the financial picture becomes clearer. Revenue concentration, margin stability, volatility patterns, and working-capital drag are no longer hidden behind volume but appear as measurable signals.
For FP&A teams, a cleaner portfolio improves the quality of financial insight. It enables a more reliable view of revenue trends, risk exposure, and how the business is likely to behave as it scales. Rather than forecasting through noise, teams can base decisions on data that reflects the true economics of the portfolio.
This article explores what rationalization immediately reveals, how it changes the structure of the FP&A model, and why it ultimately provides a more reliable view of a company’s future revenue trajectory.
Once low-performing SKUs are removed, the portfolio begins to show its actual economic structure. Patterns that were previously distorted by fringe products become easier to measure, giving FP&A a clearer view of how revenue is likely to develop. The immediate signals typically surface in margin concentration, volatility patterns, cash conversion, and capacity use.

SKU rationalization frequently lifts blended gross margin because revenue consolidates around higher-margin items. L.E.K.’s 2023–24 packaging study estimates that companies see an immediate improvement of roughly 65–90 basis points after reducing SKU count, with additional gains possible as volume shifts toward the core portfolio.
This pattern has played out publicly. Unilever and Nestlé both removed unprofitable or slow-moving SKUs in recent years. Nestlé alone exited approximately $750 million in low-performing SKU revenue between 2022 and 2024, but reported stronger margin performance as sales concentrated on higher-contribution categories. The topline dipped in discontinued items, but the underlying margin base strengthened.
For FP&A, this change requires re-computing blended gross margin, updating contribution tables, and reassessing how concentrated the company’s revenue has become after rationalization.
When long-tail SKUs are removed, the remaining demand signals become more stable. McKinsey’s portfolio simplification cases show that SKU reduction typically increases sales per SKU by about 5% while reducing per-SKU volatility. For FP&A, this means the demand series for core products often displays lower variance and stronger autocorrelation, which improves model fit.
Technically, this is the point where forecast error begins to shrink. After rationalization, FP&A can recompute residual variance at both SKU and portfolio levels and expect a lower standard deviation and tighter 95% confidence intervals on aggregated revenue. With fewer noisy items distorting the signal, the portfolio’s true revenue pattern becomes easier to model and monitor.
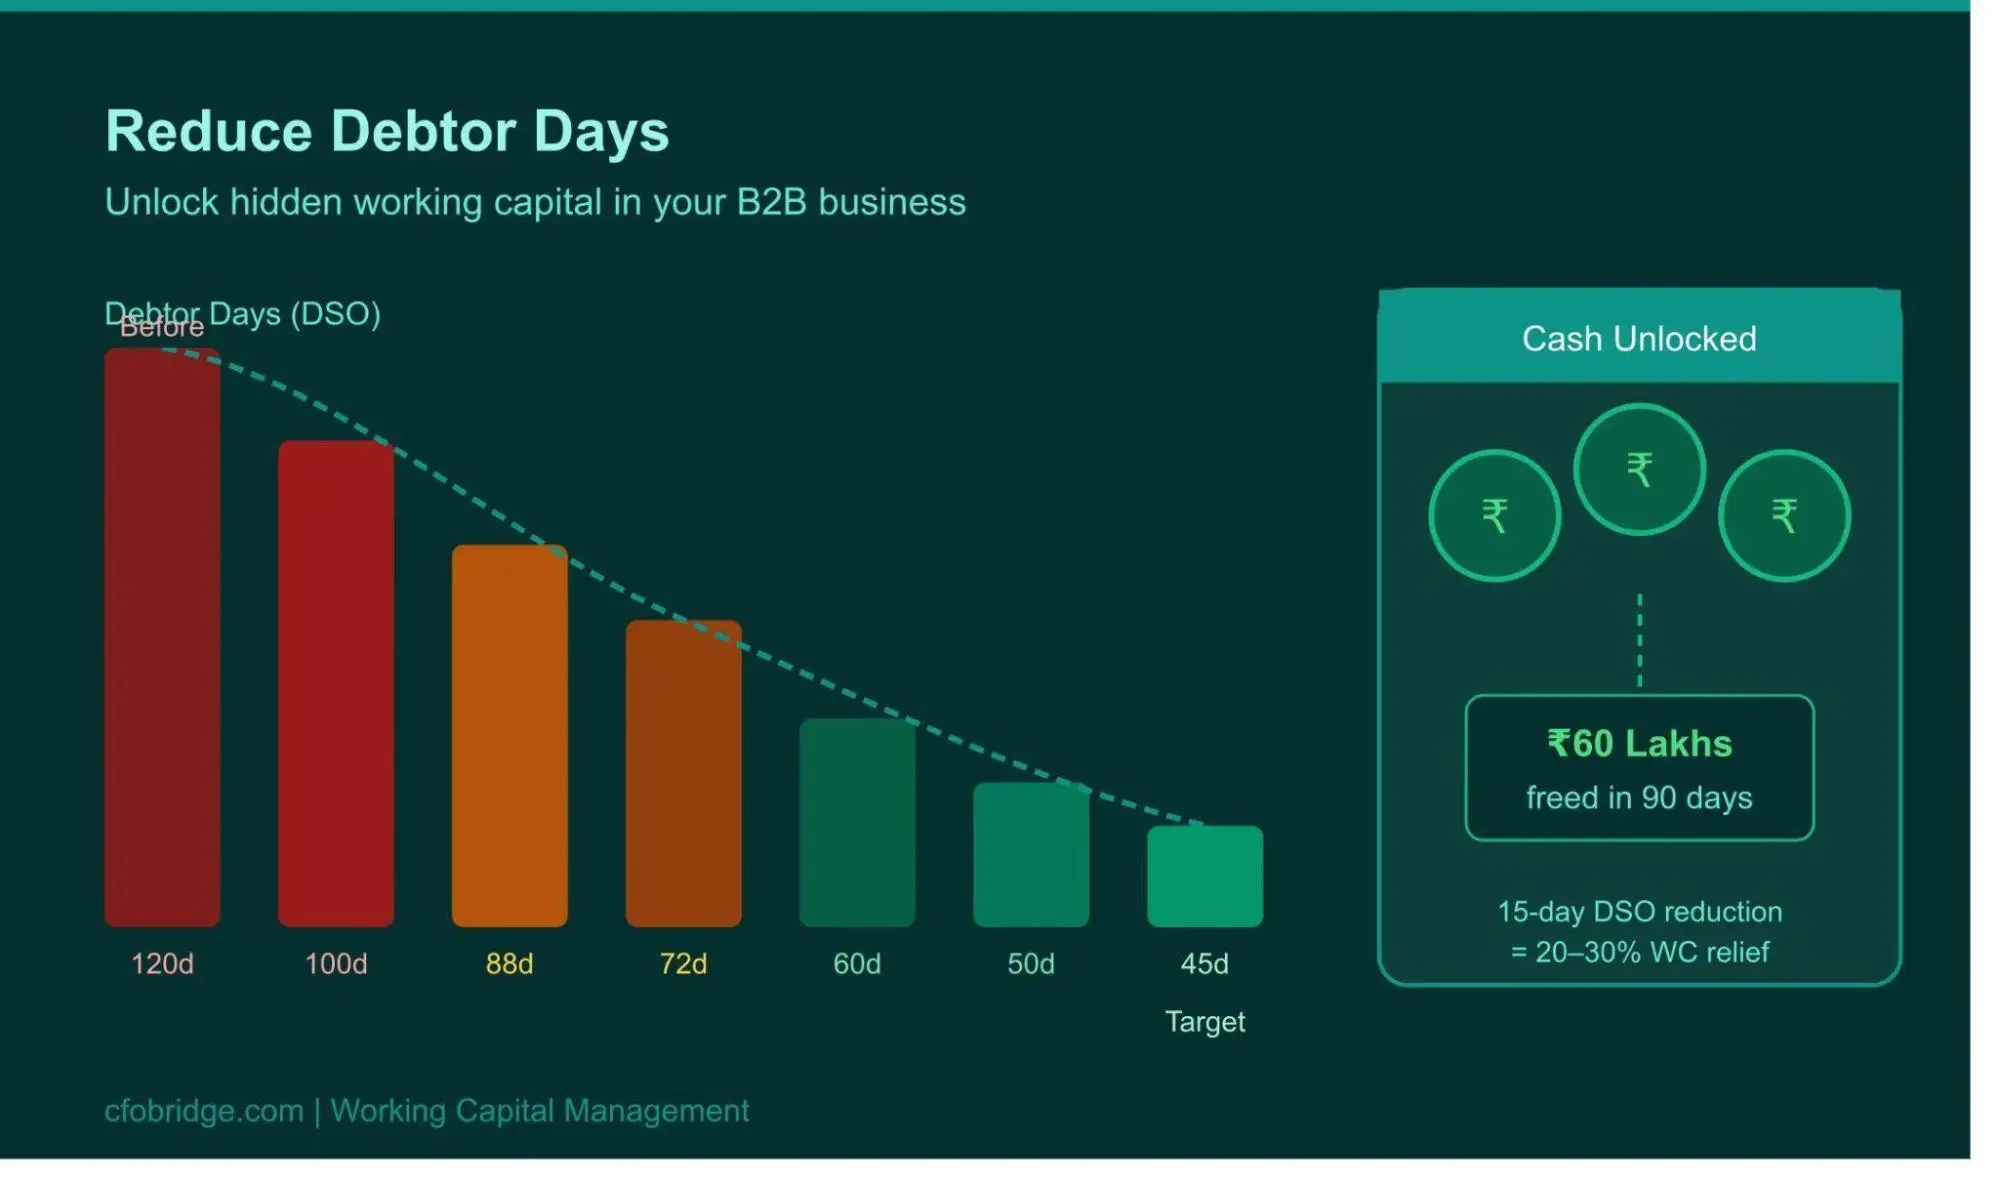
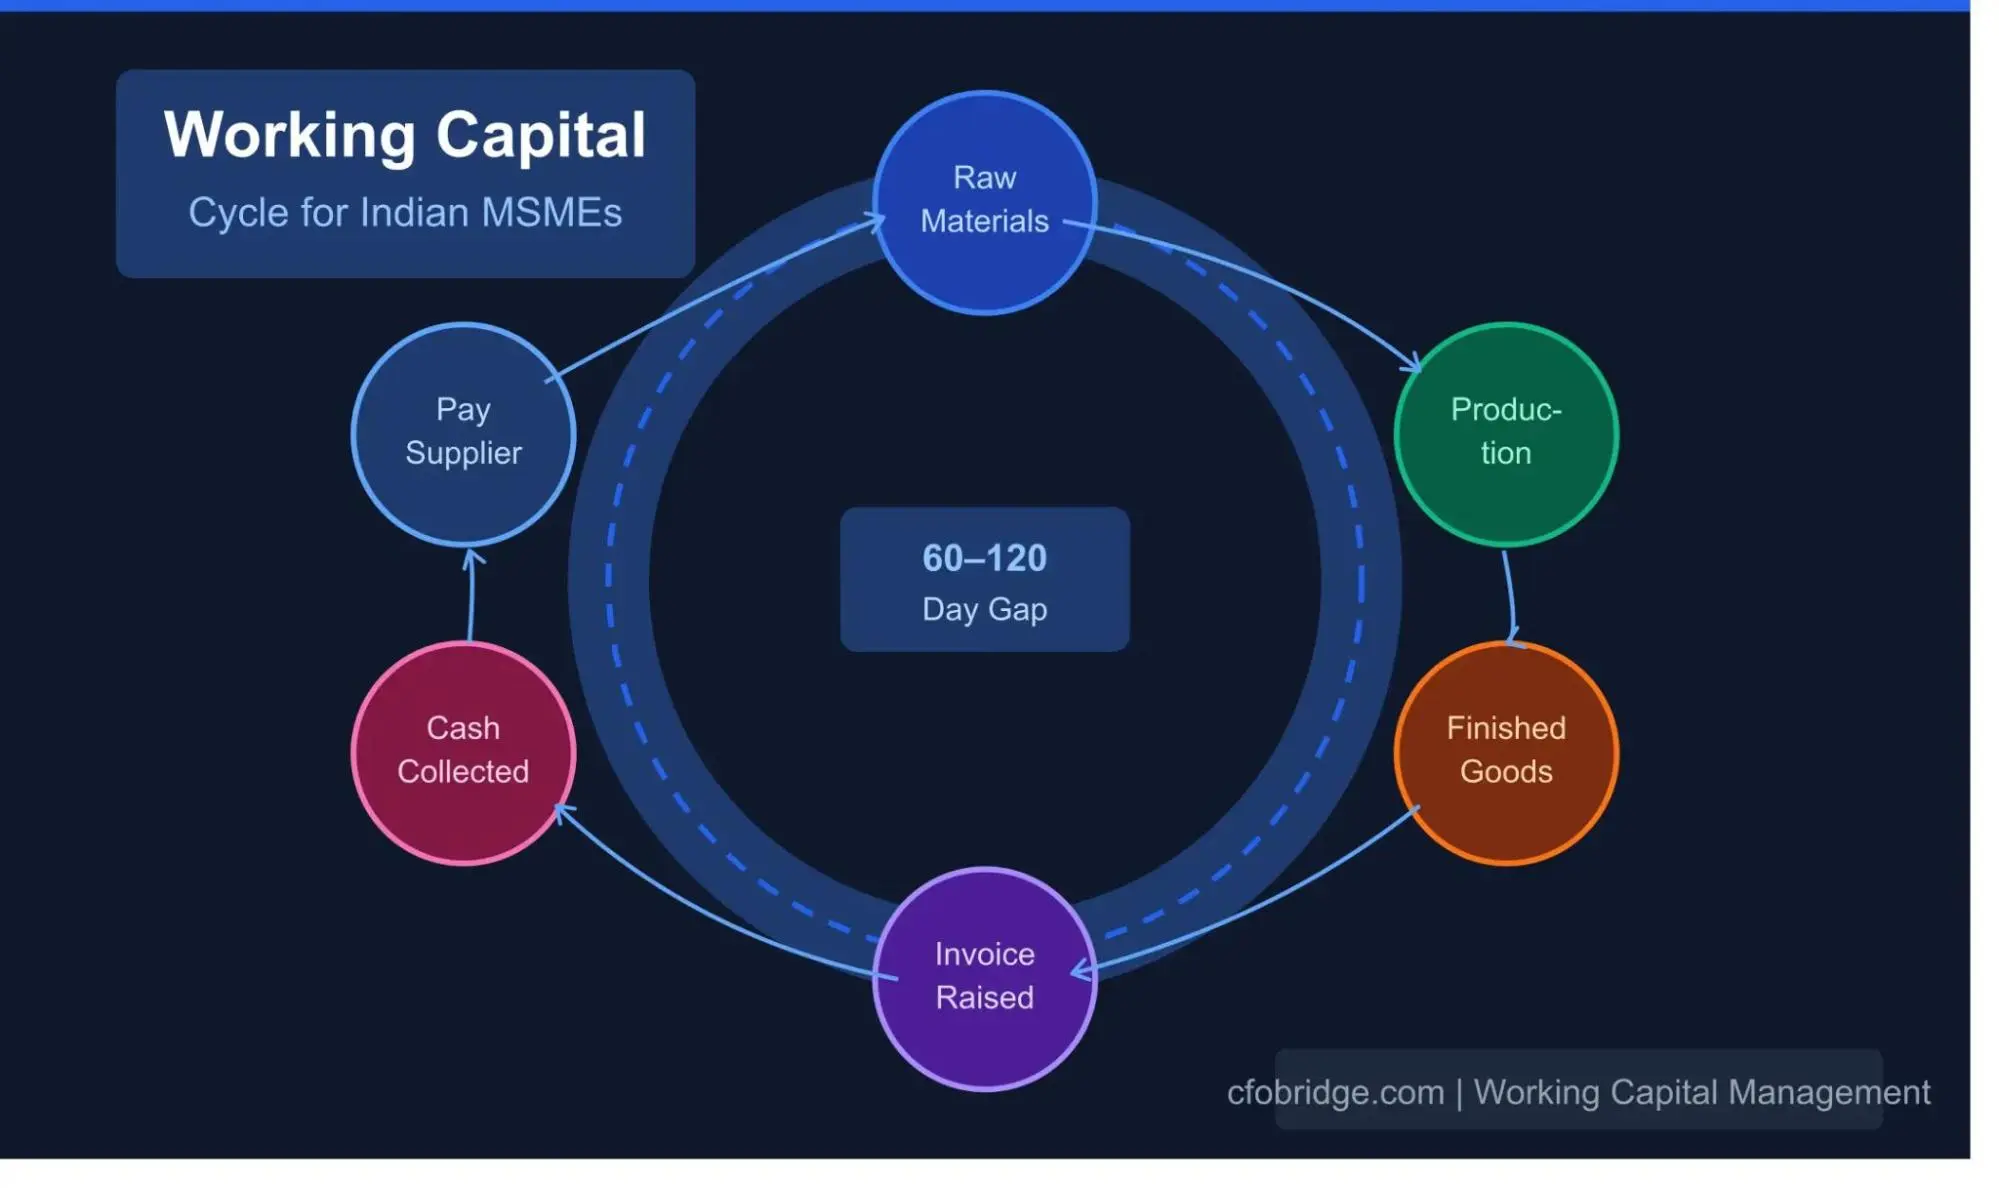
Product rationalization brings visibility to how inventory structure affects working capital. Academic work (Eindhoven University) and industry cases show that SKU-heavy portfolios typically carry higher days-inventory-outstanding (DIO) and longer cash-conversion cycles (CCC). Once slow-moving or low-velocity SKUs are removed, the true cash velocity of the portfolio becomes easier to measure and model.
In practice, simplifying the SKU base and adjusting inventory policies often leads to shorter cash conversion cycles, as excess inventory is reduced and capital is released more efficiently.
What FP&A can read immediately:
Which SKUs inflated DIO because of low turns or inconsistent pull-through.
Where net CCC extended, especially in portfolios with long tails or irregular demand.
How much working capital is released once excess inventory tied to fringe SKUs is cleared.
How cash-flow timing shifts in the 13-week horizon when only core, high-velocity SKUs remain.
Model adjustments FP&A should update:
Recalculate DIO and working-capital days by SKU cohort (core vs. discontinued tail).
Update rolling cash-flow timing to reflect a shorter CCC.
Revise inventory-policy assumptions for the remaining portfolio (safety stock, reorder points, turns).
With the long tail removed, the portfolio’s actual cash-conversion pattern becomes clearer, which strengthens both liquidity planning and short-term forecasting.
Rationalization allows companies to concentrate production and marketing resources on high-velocity SKUs. By reducing low-performing variants, throughput improves, changeovers decrease, and utilization rises, lowering per-unit costs. Operational case studies illustrate significant improvements: one machinery firm consolidated its portfolio from roughly 800 variants to 25, achieving faster lead times and stronger sales. For FP&A, this means updating models to reflect capacity-driven cost reductions and reallocating marketing or production budgets to the products that now drive the bulk of revenue and margin.
Product rationalization extends beyond portfolio cleanup and alters key financial modeling inputs. Removing low-performing SKUs produces measurable changes in revenue dynamics, margins, forecast accuracy, and working-capital needs.
Adjusts revenue run rate: Core SKUs show higher sustainable run rate; post-rationalization, McKinsey cases report ~5% sales improvement. Recompute baseline run rate excluding fringe SKUs.
Alters blended margin: L.E.K. estimates a 65–90 bps lift; some clients see 2–3% improvement. FP&A should update blended GM and sensitivity tables.
Smooths forecast variance: Forecast error and scenario ranges shrink; SKU consolidation improves near-term demand signal clarity.
Shrinks working-capital requirements: Reduced inventory cushions lower DIO and release cash; CCC improvements often reach low double-digit percentages.
Changes contribution margin by segment: Simplified portfolios shift profitability mix; re-run product-level contribution waterfalls.
Reduces SKU-level noise in demand planning: Collapsing or removing low-signal SKUs improves On-Time In-Full (OTIF) and planning accuracy.
These changes give FP&A a clearer foundation to forecast revenue, allocate resources, and assess profitability. By updating models along these dimensions, teams can make forward-looking decisions with greater confidence and precision.
After removing low-performing SKUs, your portfolio’s signals become much cleaner. This is where you, as an FP&A professional, can extract forward-looking insights to make better revenue, margin, and capital decisions. Focus on the following dimensions:
You need to understand the true growth potential of the retained portfolio. Compare pre- and post-rationalization Compound Annual Growth Rate (CAGR) for your core SKUs to see how revenue is likely to trend. Don’t just look at aggregate numbers—analyze SKU cohorts individually. If a core SKU’s growth accelerates post-rationalization, adjust your 12–36 month forward run rate in your models and use it to recalibrate strategic forecasts and capacity planning.
Long-tail SKUs can distort seasonal patterns, hiding the real peaks and troughs. Identify which SKUs contribute noise and remove them from your seasonal calculations. Then, recompute seasonal indices at SKU or product-family level. Feed this refined seasonality into your monthly or quarterly forecasts so your revenue planning reflects the actual timing of sales, not random spikes from fringe SKUs.
Simplified portfolios give you more reliable volume data for pricing analysis. Use the retained SKUs to rerun price-elasticity regressions and update price sensitivity scenarios. This helps you understand how demand responds to price changes in your core products and informs pricing, promotion, and discount strategies. Avoid using historical elasticity from long-tail SKUs—they can mask the true behavior of your high-value products.
With rationalization, volumes concentrate on fewer products, creating opportunities for operational leverage. Examine how gross margin shifts for each SKU and model the impact of reduced Selling, General & Administrative expenses (SG&A) and production complexity. Update your unit cost and SG&A allocation assumptions in your FP&A model to reflect these changes. This ensures your margin projections are realistic and tied to operational improvements, not diluted by low-margin SKUs.
SKU reduction often improves inventory turns and shortens your cash conversion cycle. Identify which products were dragging DIO/DSO and track how rationalization affects working-capital requirements. Recompute Trailing Twelve Months (TTM) inventory turns, Days Inventory Outstanding (DIO)/ Days Payable Outstanding (DPO)/(DIO), and liquidity metrics post-rationalization. Use these updated numbers to forecast cash availability more accurately and plan for reinvestment or debt reduction.
Actionable takeaway: Treat rationalization as a diagnostic tool as a financial diagnostic tool. Use the cleaned portfolio to test forward assumptions, identify capital constraints, and align revenue, margin, and liquidity planning with the products that truly drive your business. Incorporate metrics like retained SKU revenue run rate, blended GM%, SKU concentration (HHI/top-3 %), CCC changes, and forecast Root Mean Square Error (RMSE) into your dashboards to track the real impact.
Disciplined product rationalization delivers measurable financial benefits. Studies and case examples consistently show margin improvements, from basis points to low single-digit percentages, more accurate forecasts, and released working capital. When FP&A treats rationalization as a finance event rather than a product exercise, the firm gains measurable margin uplift, tighter forecast error bounds, and improved working-capital efficiency, changes that materially clarify future revenue trajectory.
CFO Bridge specializes in guiding businesses through this process. Our FP&A experts help identify low-performing SKUs, model the financial impact of rationalization, and translate portfolio simplification into actionable revenue, margin, and cash flow insights. If your business struggles with portfolio noise, volatile forecasts, or working-capital drag, consulting with CFO Bridge ensures rationalization directly strengthens your bottom line and future revenue planning.
Reach out to CFO Bridge today to align your product portfolio with predictable financial performance.
Product rationalization is the process of identifying and removing low-performing SKUs from a portfolio. It clarifies which products drive revenue and margins, reduces noise in financial models, and improves cash conversion and forecast accuracy.
By removing low-contribution or loss-making SKUs, revenue concentrates on higher-margin products. This typically lifts blended gross margin and allows FP&A teams to model profitability more accurately.
Rationalization reduces the number of noisy, low-volume SKUs, resulting in more stable demand signals. Forecast errors shrink, confidence intervals tighten, and revenue patterns become easier to predict.
Removing slow-moving SKUs reduces inventory levels and shortens the cash conversion cycle. This improves liquidity, frees working capital, and allows for more precise cash-flow forecasting.
Teams should update revenue run rates, recompute blended gross margins, revise inventory assumptions, recalibrate forecast variance, and model operational leverage to reflect the simplified portfolio.

Answer a few questions and get matched with experts who’ve helped 500+ businesses like yours.
CEO Description
Here's a curated list of finance leaders for your industry and company size.
Finding your perfect CFO partners...


Our talented team will reach you out shortly.
Let's talk! Book your free consultation today