Allow Cookies ?
To enhance your browsing experience on our website, we utilize cookies. For more detailed information regarding our use of cookies, kindly refer to our privacy policy.
Allow Cookies
Allow Cookies ?
To enhance your browsing experience on our website, we utilize cookies. For more detailed information regarding our use of cookies, kindly refer to our privacy policy.
Allow Cookies


Posted On 2025-05-30
Author Hitesh Kothari
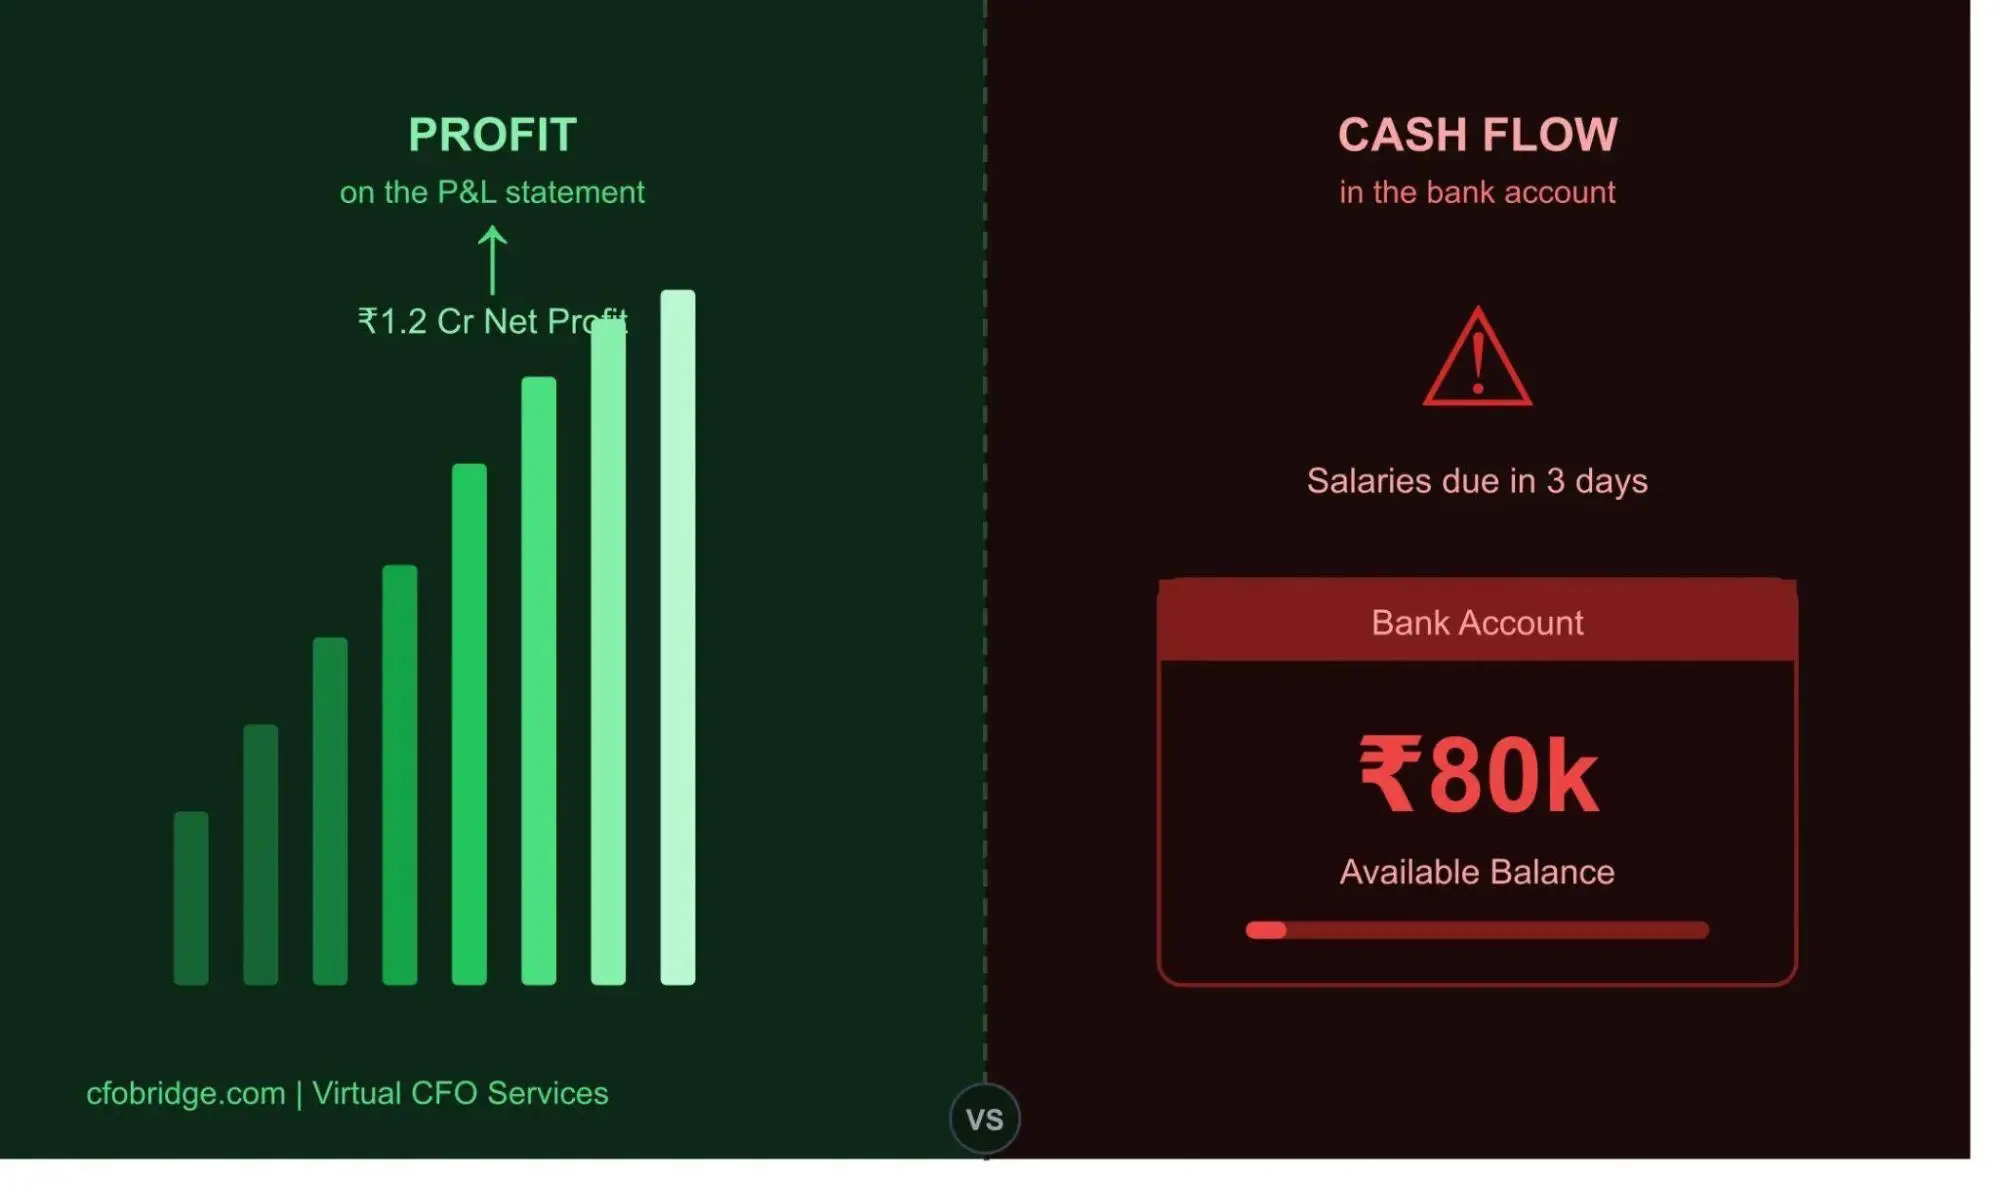
Top-line revenue and EBITDA have long been the go-to metrics for measuring business performance. But are they enough to capture the full financial health of your company?
While these traditional KPIs offer important insights into sales growth and operating profitability, they may fail to capture other critical dimensions of financial health, such as cash flow efficiency, long-term customer value, and the effective deployment of capital. This gap can mask underlying risks that affect sustainable growth.
For finance teams working with part-time CFOs, this means adopting smarter KPIs that reveal what topline and EBITDA often hide: risk exposure, cash strain, and underperforming segments.
Over the past decade, top-line revenue and EBITDA have become standard metrics across boardrooms and earnings reports. Investors rely on them. Founders structure entire pitch decks around them. And internal teams often tie growth targets to them.
Top-line reflects total revenue. It tracks sales volume, pricing, and expansion at the broadest level. When businesses want to measure growth, this is where they look first.
EBITDA isolates operating performance. It strips out interest, taxes, depreciation, and amortization—factors that vary based on financing or accounting strategy. That’s why private equity and boardrooms often treat EBITDA as a proxy for core profitability.
Bottom-line, or net income, tells you what’s left after all costs. It accounts for everything—fixed costs, variable costs, debt service, taxes—and reflects the company’s true earnings position.
Looking at recent data, the S&P 500 saw about 4% revenue growth year-over-year in Q4 2023. This marks 13 quarters in a row of growing sales. Sustained top-line growth reinforces revenue as a core indicator of business performance and investor confidence.
At the same time, earnings growth, which relates closely to EBITDA and bottom-line figures, grew by about 3.2% in the same quarter. While positive, this gap between revenue and earnings growth signals that higher sales don’t automatically translate into proportional profit gains.
This gap points to challenges companies face — rising costs, tighter margins, or inefficiencies that hold back earnings growth. It shows why relying only on top-line and EBITDA can miss important details.
Finance teams need more than these traditional metrics. Other KPIs can track costs, cash flow health, asset use, and customer profitability. Together, these give a clearer, fuller picture of how the business really performs.
Top-line revenue and EBITDA offer important insights, but they have clear boundaries that can mislead if viewed in isolation.
Not all revenue growth is created equal. Without evaluating the cost structure and risk behind the numbers, growth can obscure underlying inefficiencies.
For example, growth driven by expanded credit terms or unprofitable segments adds to revenue but eats into margin and increases receivables risk. Without gross margin or unit economics layered in, the topline can’t tell you whether the growth is value-generating or value-eroding.
Where it limits: It hides margin trade-offs, channel inefficiencies, and risky customer acquisition strategies.
A company may hit its EBITDA targets but still operate under cash strain if inventories build up or receivables extend. These issues often show up only in operating cash flow or the cash conversion cycle, not in headline metrics.
Where it limits: It delays detection of short-term liquidity risks, especially in seasonal businesses or those scaling rapidly.
EBITDA excludes depreciation, which is substantial in manufacturing, infrastructure, and capital-intensive sectors. In such contexts, it gives an overstated view of cash profitability. Similarly, businesses with high interest burdens appear stronger than they are because EBITDA ignores financing realities.
Where it limits: It disconnects performance from capital structure and reinvestment needs. It fails to surface debt stress or long-term sustainability.
Finance teams often default to tracking the LTV:CAC ratio, using it as a quick gut check for marketing efficiency. A 3:1 ratio is generally considered healthy — it means you're earning back three times what you're spending to acquire a customer.
But that ratio can be misleading if you don’t ask how long it takes to realize the “LTV” part. If your CAC payback period is 18+ months, you're not scaling — you're subsidizing uncertainty. Long payback periods can quietly drain cash reserves, especially in early-stage or high-growth phases where liquidity matters more than lifetime potential.
That’s where most teams misread the signal:
A high LTV:CAC might actually point to an underpriced offer or ignored churn red flags.
Conversely, a low ratio doesn’t always mean trouble — it might just reflect a higher velocity model with short-term upside.
If you're spending heavily on acquisition without visibility on churn patterns or revenue expansion, you’re not optimizing CAC — you’re just pouring spend into a leaky funnel. Smart teams use this metric not only to track performance, but to budget forward:
Should we double down on this segment?
Is our offer priced right for long-term retention?
Can we justify CAC through upsell potential or better onboarding?
In high-ticket, long-sales-cycle businesses, LTV:CAC often paints a fuzzy picture. A $5K CAC might look reasonable next to a $200K LTV — but what if the sales cycle is 12 months, and burn rate is high? In those cases, it's not just about the ratio — it's about cash timing and risk exposure.
LTV:CAC acts as a dynamic tool that must be read in context. It should steer both short-term spend efficiency and long-term profitability planning. On its own, it doesn't replace topline or EBITDA, but it reveals what those metrics don’t: the cost of growth versus the quality of it.
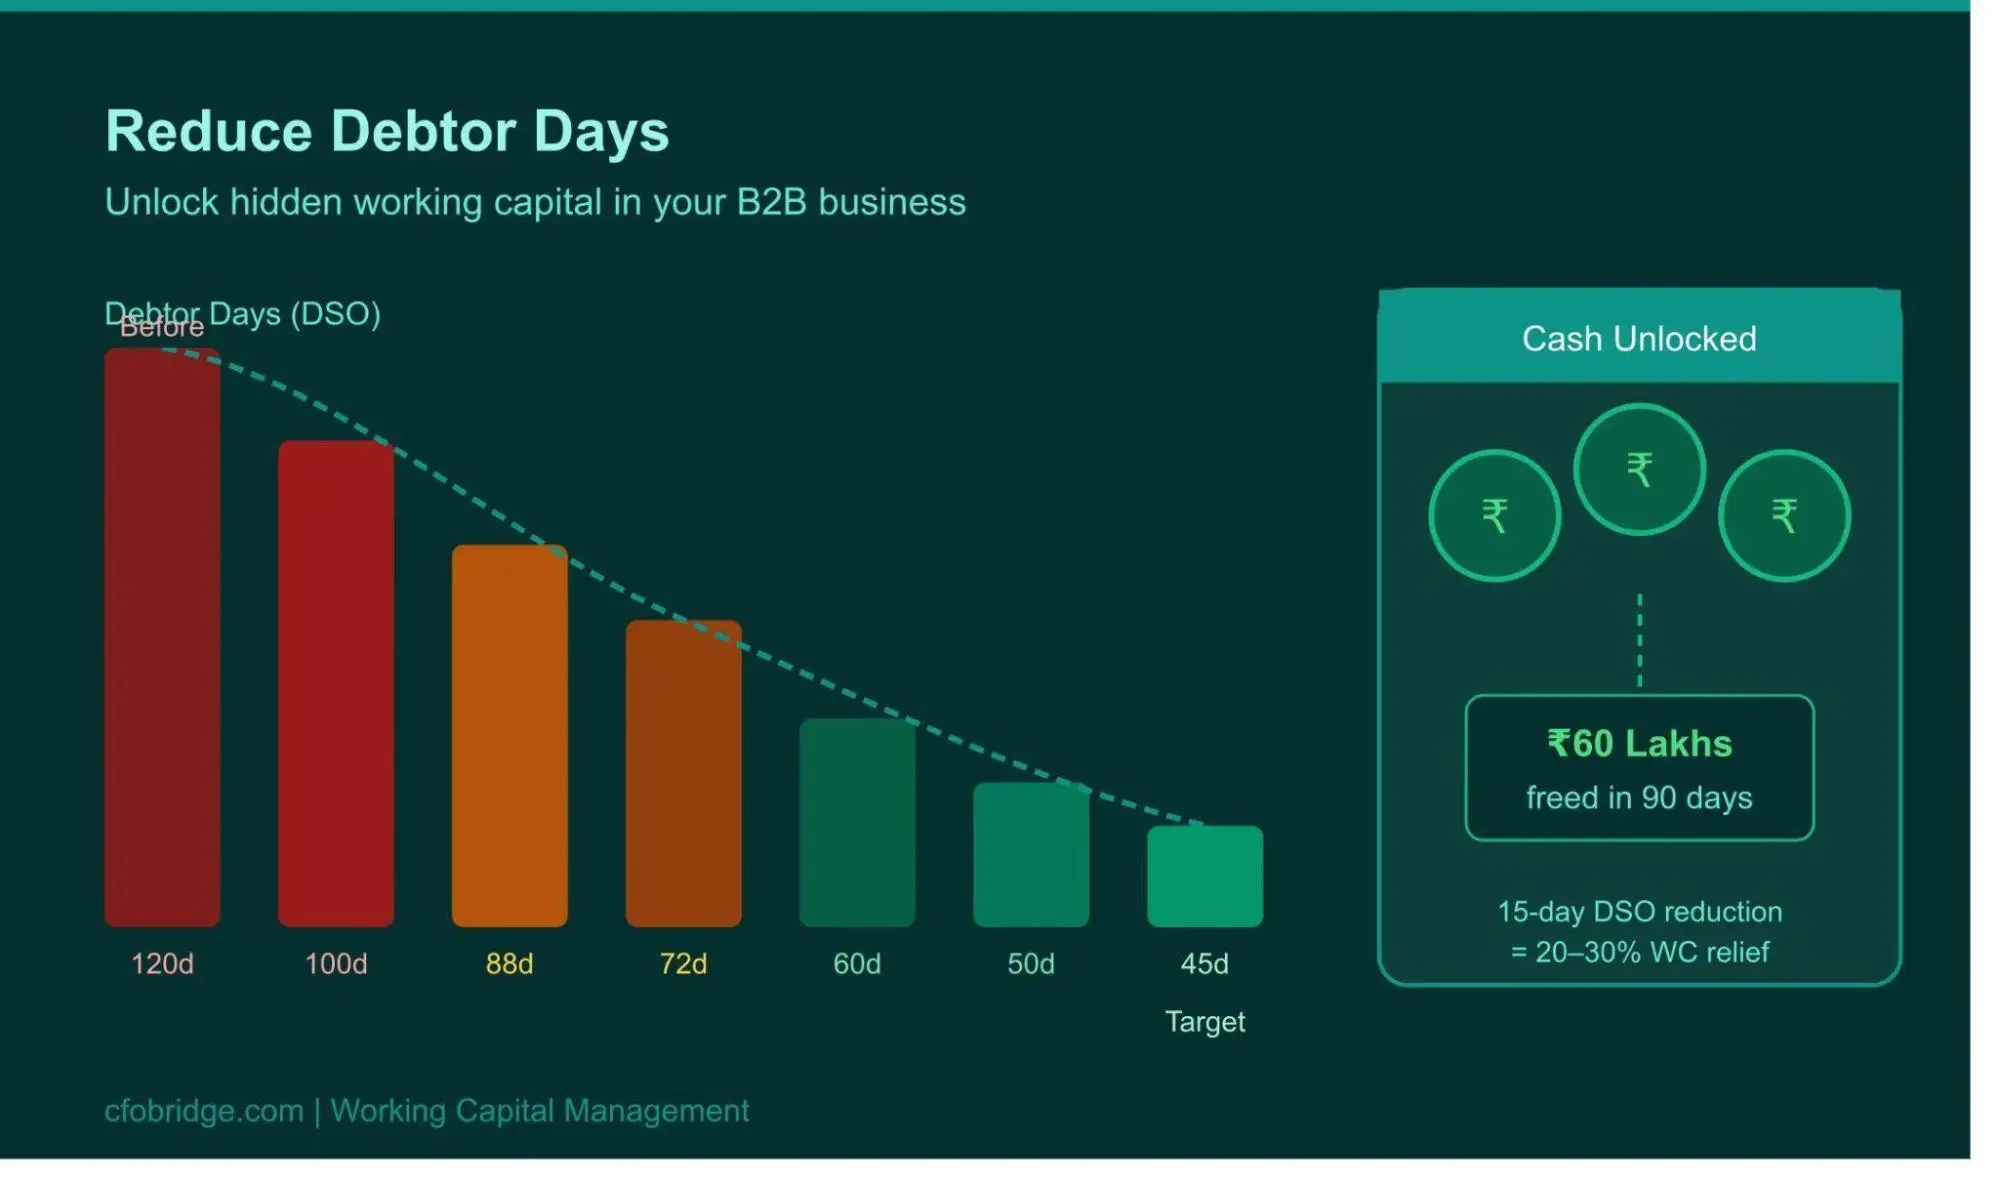
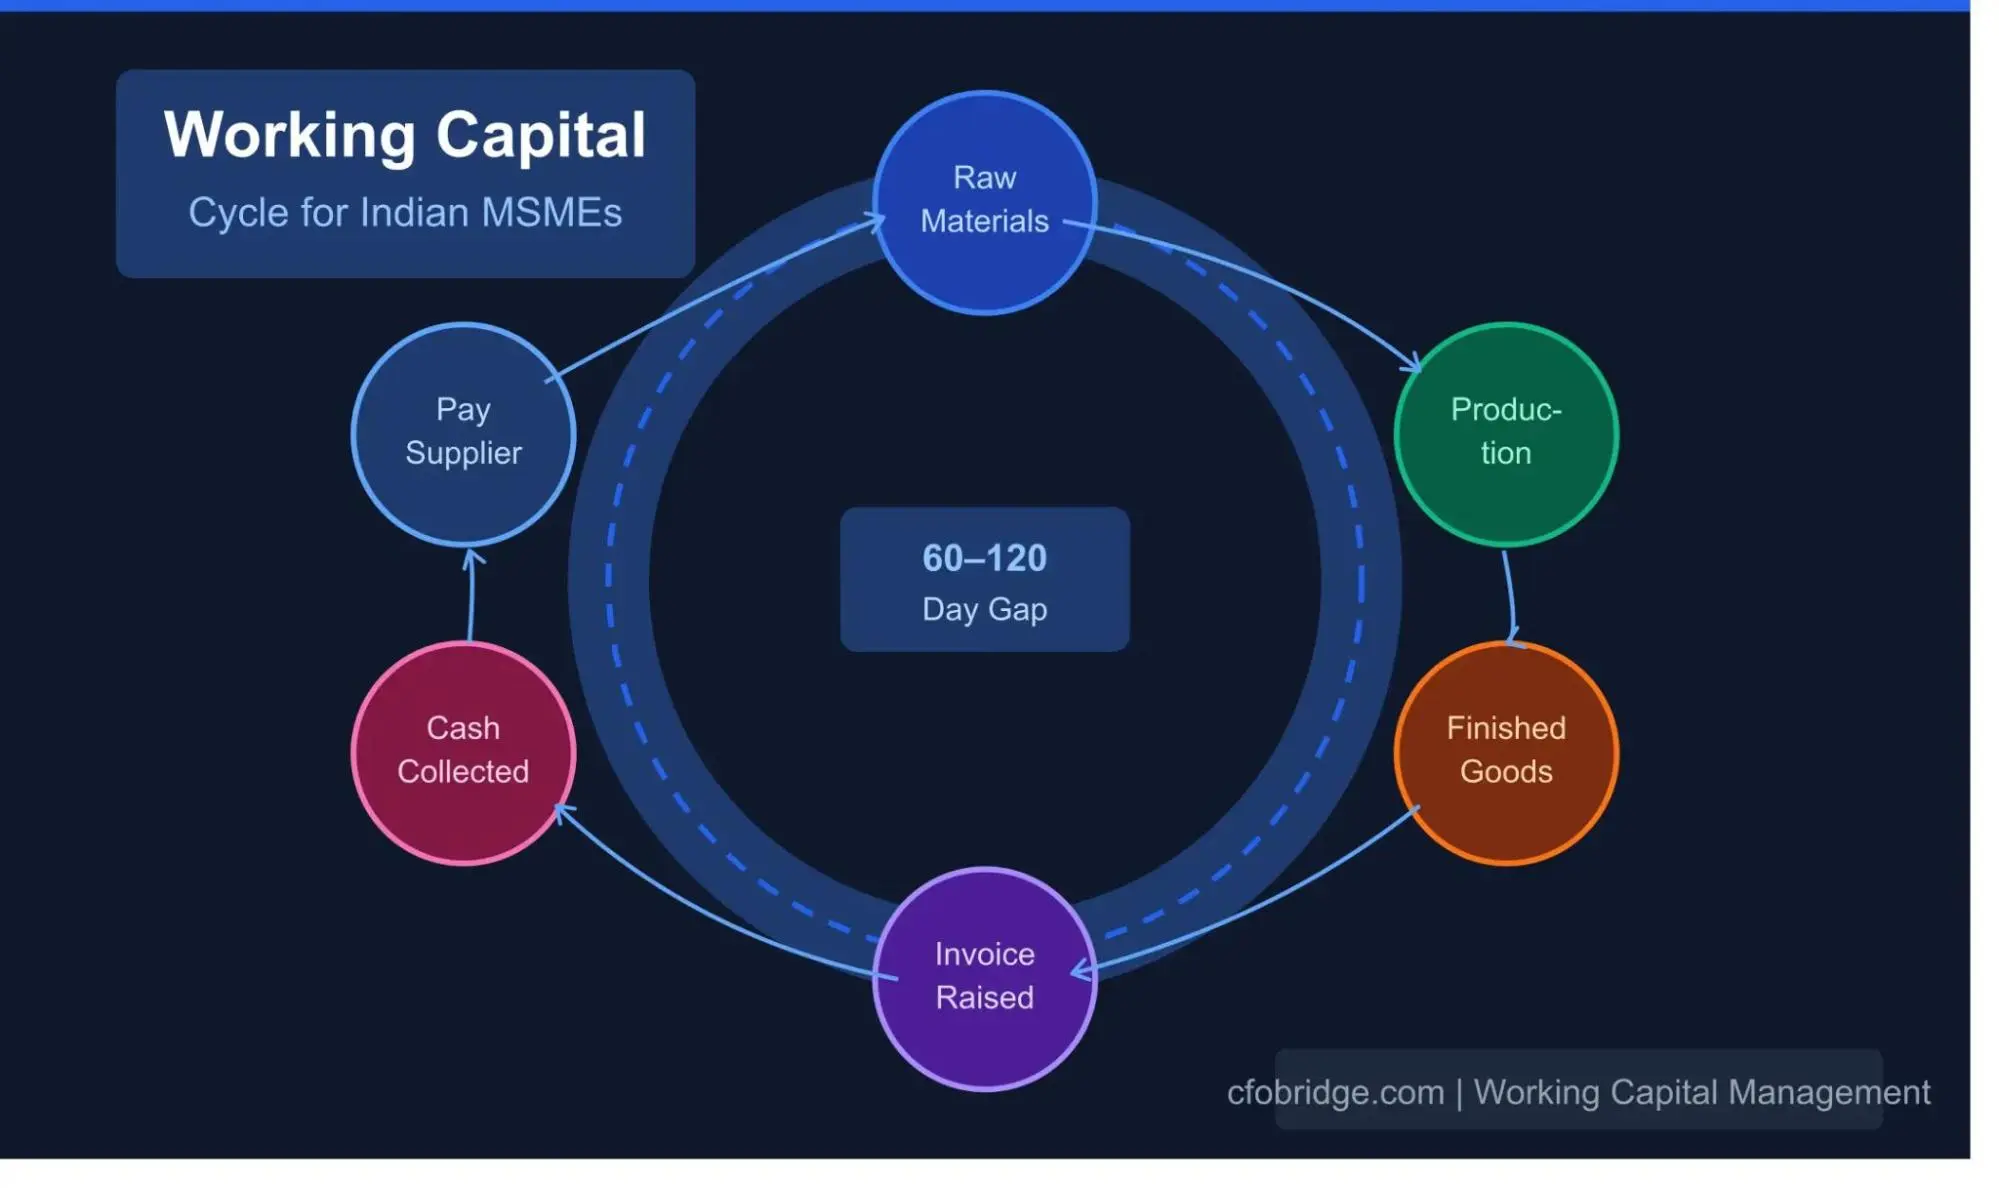
The Cash Conversion Cycle measures how long it takes a company to convert its investments in inventory and other inputs into actual cash flow from sales. It ties together inventory management, accounts receivable, and accounts payable into one sharp indicator of operational efficiency.
But CCC is more than an ops metric — it’s a lens into working capital health, especially in businesses where liquidity is king.
Let’s say your CCC is 90 days. That means cash goes out today (paying suppliers) and only comes back in three months later — assuming customers pay on time. In fast-moving sectors, that's a warning sign. Because the longer your cash is stuck in operations, the more you’re relying on external capital to stay afloat.
This metric becomes critical when:
Your sales are growing, but cash flow is tightening.
You’re profitable on paper, but burning real cash in the background.
You offer generous customer terms but don’t negotiate hard enough with your vendors.
A tight CCC doesn’t just improve liquidity — it frees up capital for reinvestment, reduces dependency on credit lines, and builds resilience during demand slumps.
Here’s how finance teams can use CCC as a strategic lever:
Spot supply chain friction early (e.g., too much inventory buildup).
Reevaluate customer credit terms that are dragging cash inflows.
Justify renegotiating payment cycles with vendors to create a buffer.
Also — context matters. A 30-day CCC in one industry may be amazing; in another, it could signal underperformance. That’s why benchmarking within your vertical is essential.
While topline and EBITDA may suggest solid performance, a bloated CCC quietly indicates capital inefficiency. You’re not maximizing the time value of money — you’re just cycling it slowly through the system. In high-growth phases, that friction can stall momentum.
Tracking CCC gives finance teams a real-time pulse on operational agility and liquidity discipline — things traditional metrics like EBITDA often overlook. It's not just about profit, it's about how fast profit becomes cash you can use.
NRR shows how much revenue you keep from existing customers after upgrades, downgrades, and churn.
For example, if you start the month with ₹1 crore in recurring revenue from your customer base and end up with ₹1.1 crore without adding any new customers, your NRR is 110%. That means your existing customers are not just staying — they’re spending more.
Top-line growth can hide churn. A business may show growth on paper by adding new customers, while silently losing old ones. NRR reveals this blind spot.
When NRR drops below 100%, it’s a sign of customer dissatisfaction or product gaps. But when it rises above 100%, it means your growth engine is working — without extra acquisition costs.
What it helps with:
Identifies gaps in customer retention
Tells if expansion revenue is working
Brings clarity for forecasting and planning
It’s not about just acquiring customers — it’s about keeping and growing them.
Burn Multiple = Net Burn / Net New Revenue
This simple ratio tells you how much cash you're burning to earn every new rupee of revenue.
On the surface, strong revenue growth might look like you're winning. But Burn Multiple forces you to ask: how much did that growth really cost you? If it takes ₹3 to make ₹1, you're not scaling — you're just delaying tough decisions.
Let’s say your net burn for the quarter was ₹6 crore, and you added ₹2 crore in net new revenue. That’s a Burn Multiple of 3.0 — you spent ₹3 to generate ₹1. That’s not efficiency. That’s a red flag.
In India’s startup ecosystem — where EBITDA is often negative by design, especially during the early-growth stages — Burn Multiple gives you a clearer picture of growth quality than traditional financial metrics.
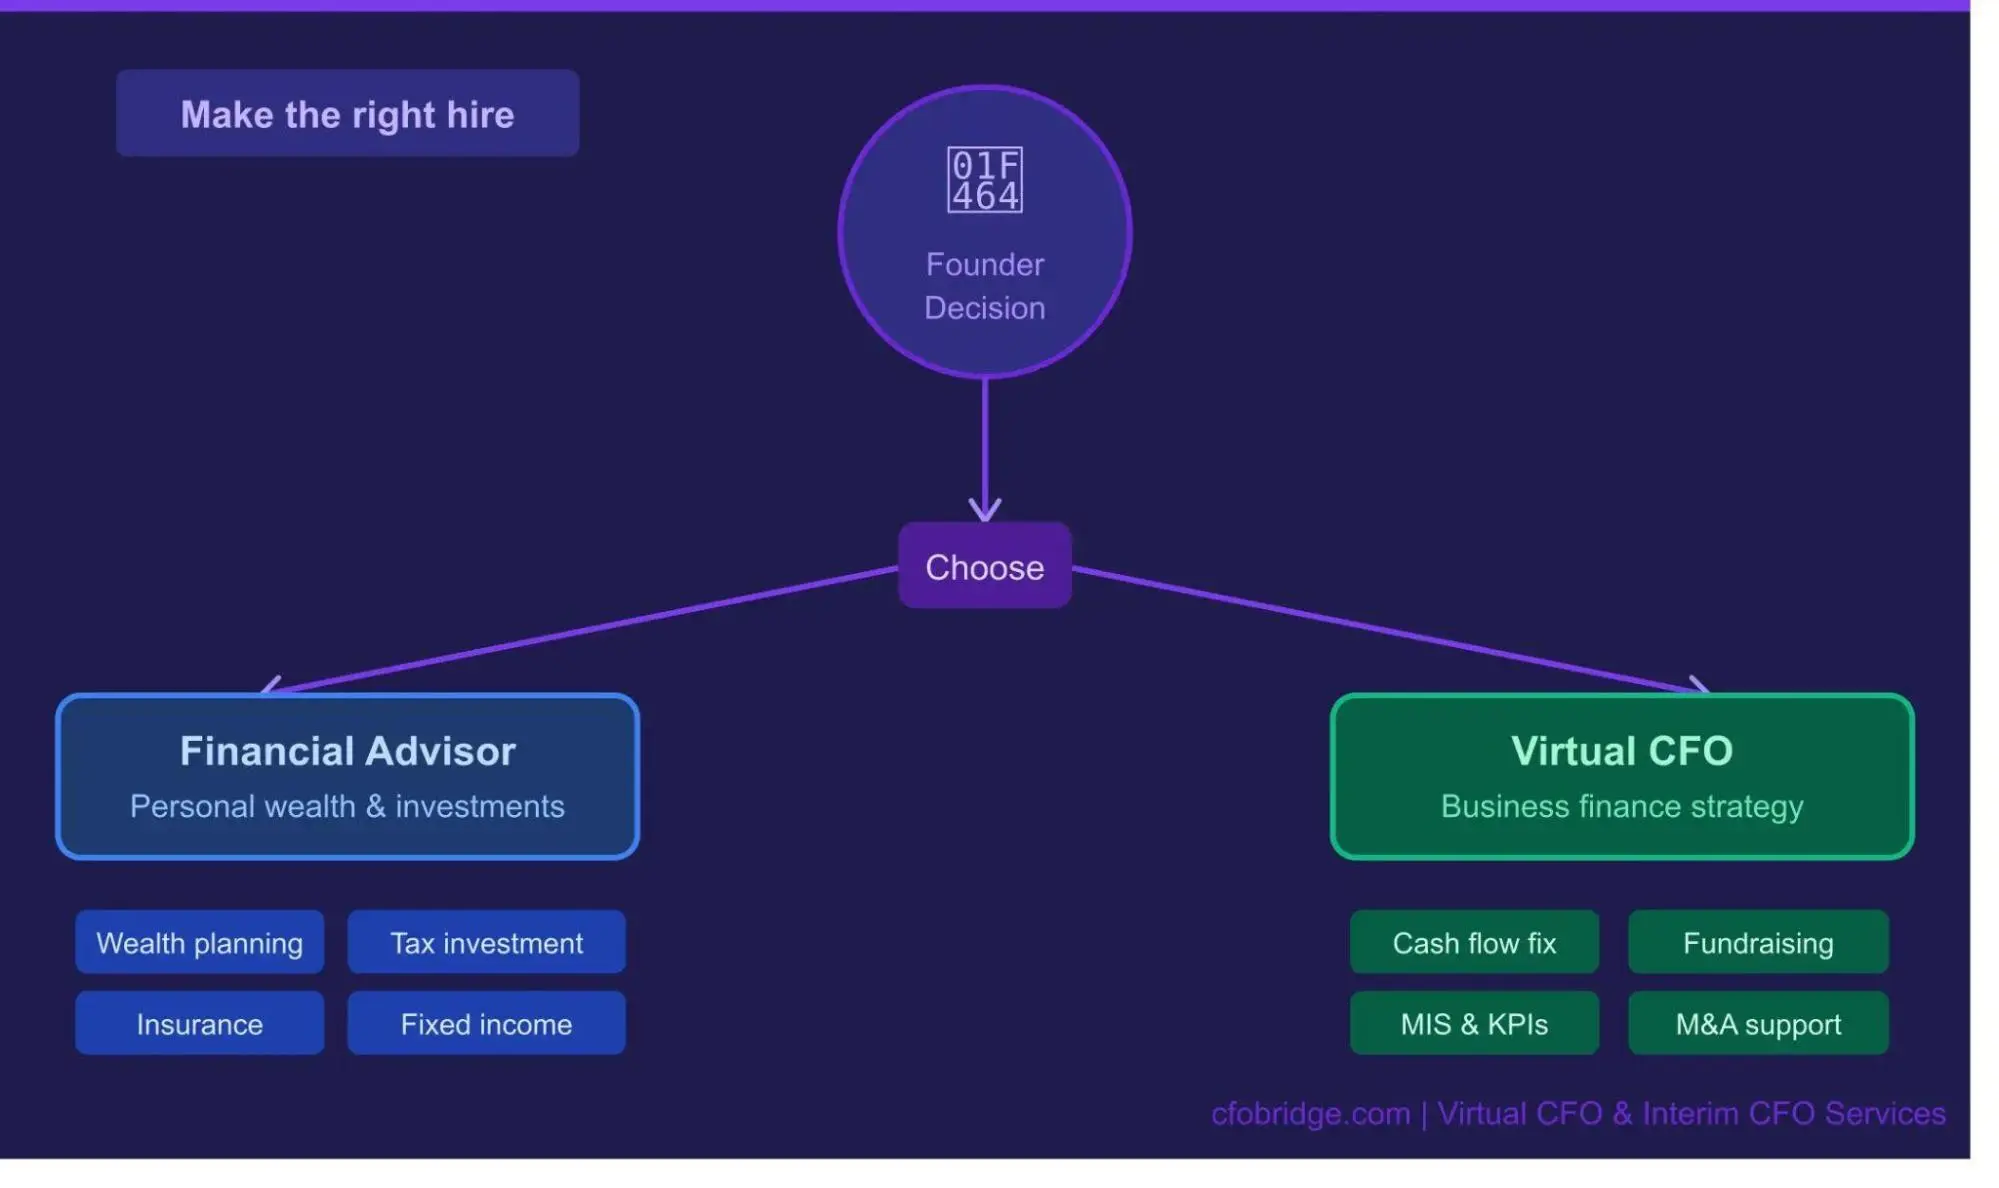
It’s one of the first metrics a seasoned part-time CFO will look at when evaluating financial discipline. Startups without a full-time finance team often rely on temporary CFO services to plug this expertise gap, ensuring decisions aren't just reactive, but data-backed and runway-aware.
It helps answer questions like:
Is our go-to-market strategy working or just expensive?
Are we over-relying on paid growth instead of improving retention or referrals?
Is our hiring plan scaling ahead of revenue — and eating up runway?
Why it belongs on your finance dashboard:
It pressures-tests capital efficiency in real-time — not just at the end of a financial year.
Helps you rethink marketing spend, headcount, and opex before it’s too late.
Reveals whether you're buying growth unsustainably or building a repeatable engine.
Topline growth might look great in isolation. EBITDA can be negative while scaling — and still make sense. But Burn Multiple tells you: how much are we burning to get each new rupee in the door?
If funding slows down, Burn Multiple becomes the quickest way to know if your business can survive — or if you’ve been burning future potential for short-term wins.
ROIC measures how efficiently a company turns invested capital into profit. While top-line revenue and EBITDA quantify size and operating performance, ROIC assesses the efficiency and profitability of capital allocation, offering deeper insight into growth quality.
Relying solely on top-line growth and EBITDA limits your visibility into critical financial factors that impact profitability and liquidity. Without comprehensive KPIs, companies may fail to identify underlying financial stresses that undermine profitability and impede strategic progress.
CFO Bridge provides targeted financial insights tailored to your business, enabling you to identify hidden risks and opportunities beyond traditional metrics. Our approach equips finance teams with the tools needed to make informed, strategic decisions that improve financial health and long-term performance.
Schedule a consultation with CFO Bridge today to gain a comprehensive understanding of your company’s financial position and develop actionable strategies that drive measurable results.
While Top-Line and EBITDA provide insights into sales growth and profitability, they don’t fully capture factors like cash flow health, customer retention, and operational efficiency, which are critical for long-term sustainability.
Finance teams are increasingly tracking cash conversion cycles, customer lifetime value (CLV), churn rates, and working capital efficiency. These metrics provide a deeper understanding of business resilience and growth potential.
Broader KPIs help identify hidden risks and opportunities, enabling proactive management of liquidity, customer relationships, and cost structures—leading to more balanced and strategic decisions.
By leveraging data analytics tools and cross-functional collaboration, finance teams can gather real-time insights and align KPIs with company goals, ensuring a comprehensive view of business performance.
Challenges include data quality issues, resistance to change, and the complexity of measuring non-financial indicators. Addressing these requires clear communication, training, and robust technology adoption.

Answer a few questions and get matched with experts who’ve helped 500+ businesses like yours.
CEO Description
Here's a curated list of finance leaders for your industry and company size.
Finding your perfect CFO partners...


Our talented team will reach you out shortly.
Let's talk! Book your free consultation today