Allow Cookies ?
To enhance your browsing experience on our website, we utilize cookies. For more detailed information regarding our use of cookies, kindly refer to our privacy policy.
Allow Cookies
Allow Cookies ?
To enhance your browsing experience on our website, we utilize cookies. For more detailed information regarding our use of cookies, kindly refer to our privacy policy.
Allow Cookies


Posted On 2025-08-11
Author Sudhakar Thamankar
When someone asks, "How's your business doing?", what do you say?
Most founders or SME owners instinctively talk about sales growth, new clients, or day-to-day challenges. But behind all that is a more objective, silent storyteller - your Profit & Loss Statement (also known as the Income Statement).
It tells the story of your business in numbers, highlighting what worked, what didn't, and what's changing. Think of it as your company's annual progress report. Just like a school report card, it shows whether your performance was exceptional (AA+), good (A+), or needs improvement. It's an honest reflection of how your business has performed.
Let's break it down in plain language.
Profit and Loss account or income statement is part of the financial statement. It's a summary of your business performance over a specific period - typically a month, quarter, or year.
It tells you:
Simple, right? But the insights it holds go far deeper.
Under this head, all income earned by the business during the reporting period is recorded, whether from the sale of products or the provision of services. Revenue includes both cash and credit sales, regardless of whether the payment has been received.
It also encompasses:
Unbilled Revenue: Income for services already rendered, but where the invoice has not yet been raised. This is recognized under accrual accounting since the earning process is complete.
Deferred Revenue: Amounts received in advance from customers for goods or services yet to be delivered. Although the cash is received, this portion is initially recorded as a liability and gradually recognized as revenue when the service or product is delivered.
This comprehensive approach ensures that revenue reflects the actual business activity for the period, aligning with the accrual principle of accounting.
Cost of goods or Cost of service means the direct costs incurred to produce the goods or deliver the services that a company has sold or rendered during the period.
For a Product-based Company:
If your revenue is ₹1,00,000 from product sales, then COGS would include:
COGS = Only for the products sold, not for unsold inventory.
For a Service-based Company:
COGS (or Cost of Services) includes:
For Example:
If your revenue is ₹1,00,000 from IT consulting:
₹60,000 - consultant salary for billed hours
₹10,000 - travel for the project
₹5,000 - tool/software used for the project
Total Cost of Services = ₹75,000
Gross Profit is the profit a company makes after deducting the cost of goods or services sold (COGS) from its revenue.
Gross profit isn't just a number - it's a key strategic metric for pricing, product mix, vendor negotiation, and unit economics
Mathematically, gross profit is calculated as below:
Gross Profit = Revenue - COGS
What does this tell the Founder?
Why Gross Profit is Important:
Contribution margin is somewhat similar to Gross profit. Contribution Margin (CM) tells you how much money is left from sales after covering variable costs, and how much is available to cover fixed costs and profit.
While calculating Gross profit, COGs include both fixed and Variable costs, and in computing contribution margin, we consider only variable costs.
It measures how much is left to cover fixed costs and generate profit. Contribution Margin is used more for Internal decision-making.
These are indirect expenses: rent, salaries (non-production), marketing, admin, software, etc, and all other indirect expenses.
This is where small businesses often bleed cash unknowingly.
It shows how much profit a business generates from its core operations, before the impact of financing (interest), taxation, and non-cash expenses (depreciation and amortization).
A positive and growing EBITDA indicates the business is operationally healthy, can fund its growth, and is attractive to investors or lenders.
Why Certain Items Are Excluded:
Interest Expense:
Not part of core operations; depends on the company's financing structure (debt vs equity).
Two companies doing the same business could have different interest costs.
Tax:
A statutory obligation based on profits, not an operating cost.
Depreciation & Amortization:
Non-cash expenses that spread the cost of long-term assets over their useful life.
While the cost has already been incurred, EBITDA removes these to focus on cash-generating ability.
EBITDA is a strong indicator of core business performance - it tells whether the business is generating enough operating profit before external factors like interest and taxes, and non-cash accounting adjustments. However, EBITDA should not be the only metric used, as it ignores debt levels, capital expenditures, and working capital needs.
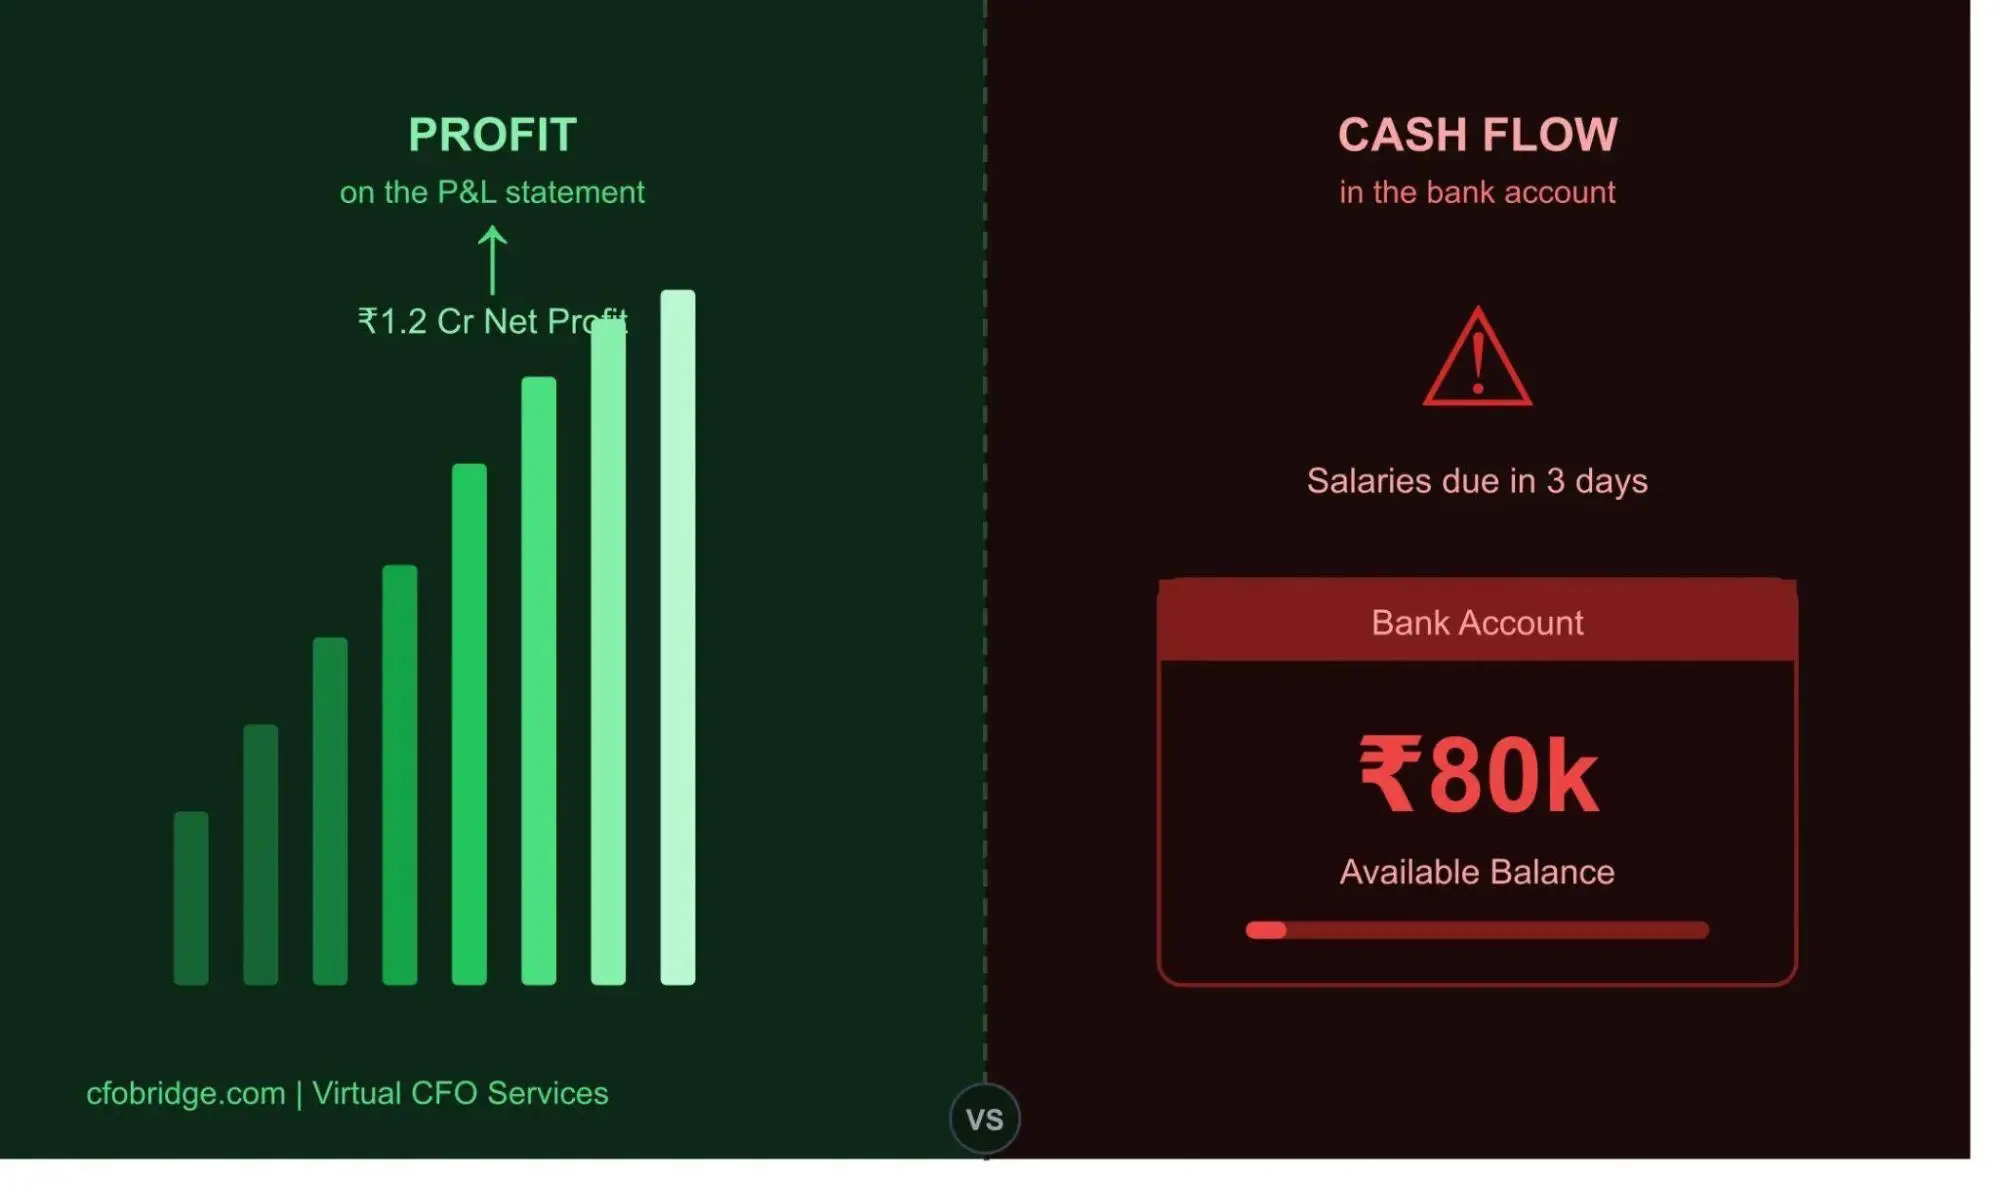
Net Profit, also known as Net Income or the Bottom Line, is the final profit a business makes after deducting all expenses - including operating expenses, interest, taxes, and any other costs - from its total revenue.
It reflects the true profitability of the business and answers the ultimate question: "How much money did the business make?"
Net Profit appears at the very bottom of the Profit & Loss (P&L) Statement, which is why it's often referred to as the "bottom line." This figure represents the company's final profit after accounting for all revenues, operating expenses, interest, taxes, depreciation, and amortization.
Once determined, the net profit is carried forward to the Balance Sheet. It is added to Retained Earnings, which form a part of the Reserves and Surplus under Shareholders' Equity. This accumulated profit can be used for reinvestment, paying dividends, or strengthening the company's financial position.
Profit & Loss statement isn't just an accounting formality - it's your business story, written in numbers. Every line reveals something critical: how well you're serving customers, how efficiently you're operating, whether your pricing works, and how resilient your model is.
Many founders and SME owners get caught up in the chaos of daily operations, but those who pause and read their P&L regularly gain a powerful edge. They don't just guess; they know. They make informed decisions on hiring, pricing, marketing, and expansion - all based on real financial performance.
So don't leave your business story unread.
Start reviewing your P&L monthly. Ask questions. Spot patterns. Take action.
Because when you understand your numbers, you're not just running a business - you're building a stronger, smarter, and more sustainable one.
A P&L statement (Profit and Loss statement) is a financial report that shows a company’s revenues, costs, and expenses over a specific period, such as a quarter or year. It’s crucial because it helps businesses track profitability, manage costs, and make informed decisions about operations and growth strategies.
The P&L statement reflects a business’s financial health by showing whether it is generating enough revenue to cover its expenses and produce profit. It highlights trends in income, costs, and net profit, providing insights into the effectiveness of business strategies and the sustainability of operations.
Revenue/Sales: The total income generated from sales of goods or services. Cost of Goods Sold (COGS): Direct costs of producing goods or services. Gross Profit: Revenue minus COGS. Operating Expenses: Costs related to day-to-day business operations, such as rent, salaries, and utilities. Net Profit: The final profit after all expenses are deducted from revenue, reflecting the true profitability of the business.
A P&L statement helps businesses make decisions by revealing profit margins, cost control opportunities, and trends in revenue growth. By analyzing the statement, business owners can identify underperforming areas, optimize pricing, and manage costs, leading to better strategies for increasing profitability and improving cash flow.
Businesses should prepare a P&L statement at least quarterly, but monthly is recommended for growing businesses or those with fluctuating revenues. Regularly updating the statement helps businesses stay on top of their financial performance and make timely adjustments to strategy, operations, and budgeting.

Answer a few questions and get matched with experts who’ve helped 500+ businesses like yours.
CEO Description
Here's a curated list of finance leaders for your industry and company size.
Finding your perfect CFO partners...


Our talented team will reach you out shortly.
Let's talk! Book your free consultation today