Allow Cookies ?
To enhance your browsing experience on our website, we utilize cookies. For more detailed information regarding our use of cookies, kindly refer to our privacy policy.
Allow Cookies
Allow Cookies ?
To enhance your browsing experience on our website, we utilize cookies. For more detailed information regarding our use of cookies, kindly refer to our privacy policy.
Allow Cookies


Posted On 2026-04-30
Author Hitesh Kothari
While most businesses monitor profit, fewer assess the amount of capital required to generate that profit. This oversight is often the source of suboptimal decisions.
It is possible to increase revenue and improve margins while simultaneously eroding value if capital is deployed inefficiently. This issue is particularly prevalent in businesses that are scaling operations, acquiring assets, or assuming debt without evaluating returns at the appropriate level. Understanding how financial planning and analysis frameworks approach capital efficiency can help businesses identify these gaps early.
Return on Invested Capital (ROIC) addresses this challenge by linking profit to the capital required to generate it, providing a clear measure of whether the business is truly creating value or merely expanding on paper.
Return on Invested Capital (ROIC) quantifies the efficiency with which a business generates profit from its invested capital.
It looks at net operating profit after tax (NOPAT) and compares it to the total capital used to run the business, both debt and equity. This makes it different from metrics that focus only on profit or only on equity returns.
At its core, ROIC answers a simple question:
For every dollar invested in the business, how much operating profit are you generating?
Because it focuses on operating performance, ROIC excludes non-operating items like excess cash. This gives you a clearer view of how well your core business is using capital to generate returns. Businesses that track KPIs beyond top-line and EBITDA often find that ROIC is one of the most revealing indicators of true business health.
ROIC has a simple structural formula, but the underlying drivers are more critical than the calculation itself.
At a fundamental level, it is determined as follows:
ROIC = NOPAT ÷ Invested Capital
NOPAT (Net Operating Profit After Tax) → your operating profit after taxes
Invested Capital → total capital used in the business (debt + equity tied to operations)
The formula can be analyzed in greater detail to reveal the factors that truly drive performance:
ROIC = (NOPAT / Revenue) × (Revenue / Invested Capital)
This gives you two clear levers:
NOPAT Margin → how profitable your operations are
Capital Turnover → how efficiently you’re using capital to generate revenue
This detailed assessment is significant, as it highlights the tendency for organizations to focus on one factor and disregard the other.
You can have strong margins but poor capital efficiency, tying up too much capital to generate revenue. Or you can run lean on capital but operate with weak margins.
ROIC brings both together. It forces you to look at profitability and capital efficiency at the same time, not in isolation.
ROIC is informative when considered alongside the cost of capital, which shows the real cost of funding the business.
This assessment serves as the basis for evaluating value creation.
If your ROIC is higher than your cost of capital, your business is generating returns above what investors or lenders expect. That’s a positive signal. If it’s lower, you may still be profitable, but you’re not generating enough return to justify the capital being used.
This is a frequent oversight: organizations focus on profit without assessing whether it justifies the capital employed.
ROIC answers how efficiently you’re using capital.
Cost of capital defines the minimum return required.
Together, these metrics indicate whether growth is generating genuine value or merely expanding scale without enhancing returns. This is exactly the insight that structured financial planning and analysis brings to capital allocation decisions.
Most businesses track multiple metrics, but each measures a different aspect. Using the wrong metric for decision-making can distort the assessment of performance.
Here’s how ROIC compares with other commonly used metrics:
Return on Equity (ROE) focuses only on the return generated for equity holders. It tells you how well shareholder money is being used. ROIC goes broader. It includes both debt and equity, giving you a view of how the entire capital base is performing.
Understanding this distinction is critical for businesses with debt in their capital structure.
With higher leverage, ROE can look stronger than it actually is. You’re amplifying returns on equity by adding debt, but that doesn’t mean the business is operating more efficiently.
ROIC provides an unbiased view, showing whether operations generate real returns regardless of the business’s financing structure.
Return on Investment (ROI) is useful, yet it captures only a partial perspective.
It’s typically applied to:
A specific project
A campaign
A one-time investment
It answers a direct question: Is this investment worth it?
ROIC operates at a different level. It looks at the entire business and asks: Are we using our total capital efficiently?
You can have strong ROI on individual projects and still run a business with weak overall capital efficiency.
For this reason, ROI is considered tactical, while ROIC provides a strategic perspective.
EBITDA is widely used because it focuses on operating earnings, stripping out financing and accounting effects to highlight core profitability. To understand the full difference between these earnings metrics, the comparison of EBITDA vs EBIT is a useful starting point. However, the scope of EBITDA remains limited.
It doesn’t consider how much capital is required to generate those earnings. That gap is critical.
A business can show strong EBITDA while tying up large amounts of capital in assets, inventory, or infrastructure. In that case, returns may look good on the surface, but efficiency is low.
ROIC closes that gap. It connects profit to the capital behind it.
Enhancing ROIC does not necessitate a comprehensive restructuring of the business. Improvement primarily depends on two key drivers:
Operating margins (NOPAT)
Capital efficiency (how effectively you use invested capital)
Focusing on these drivers directly contributes to improved ROIC performance.
This is about increasing the profit you generate from your existing operations. Understanding what’s driving margin compression is often the first step—even small improvements in pricing discipline or cost control have a direct impact on ROIC by increasing the numerator, your operating profit.
You can do this by:
Improving pricing discipline
Reducing unnecessary operating costs
Streamlining processes to protect margins
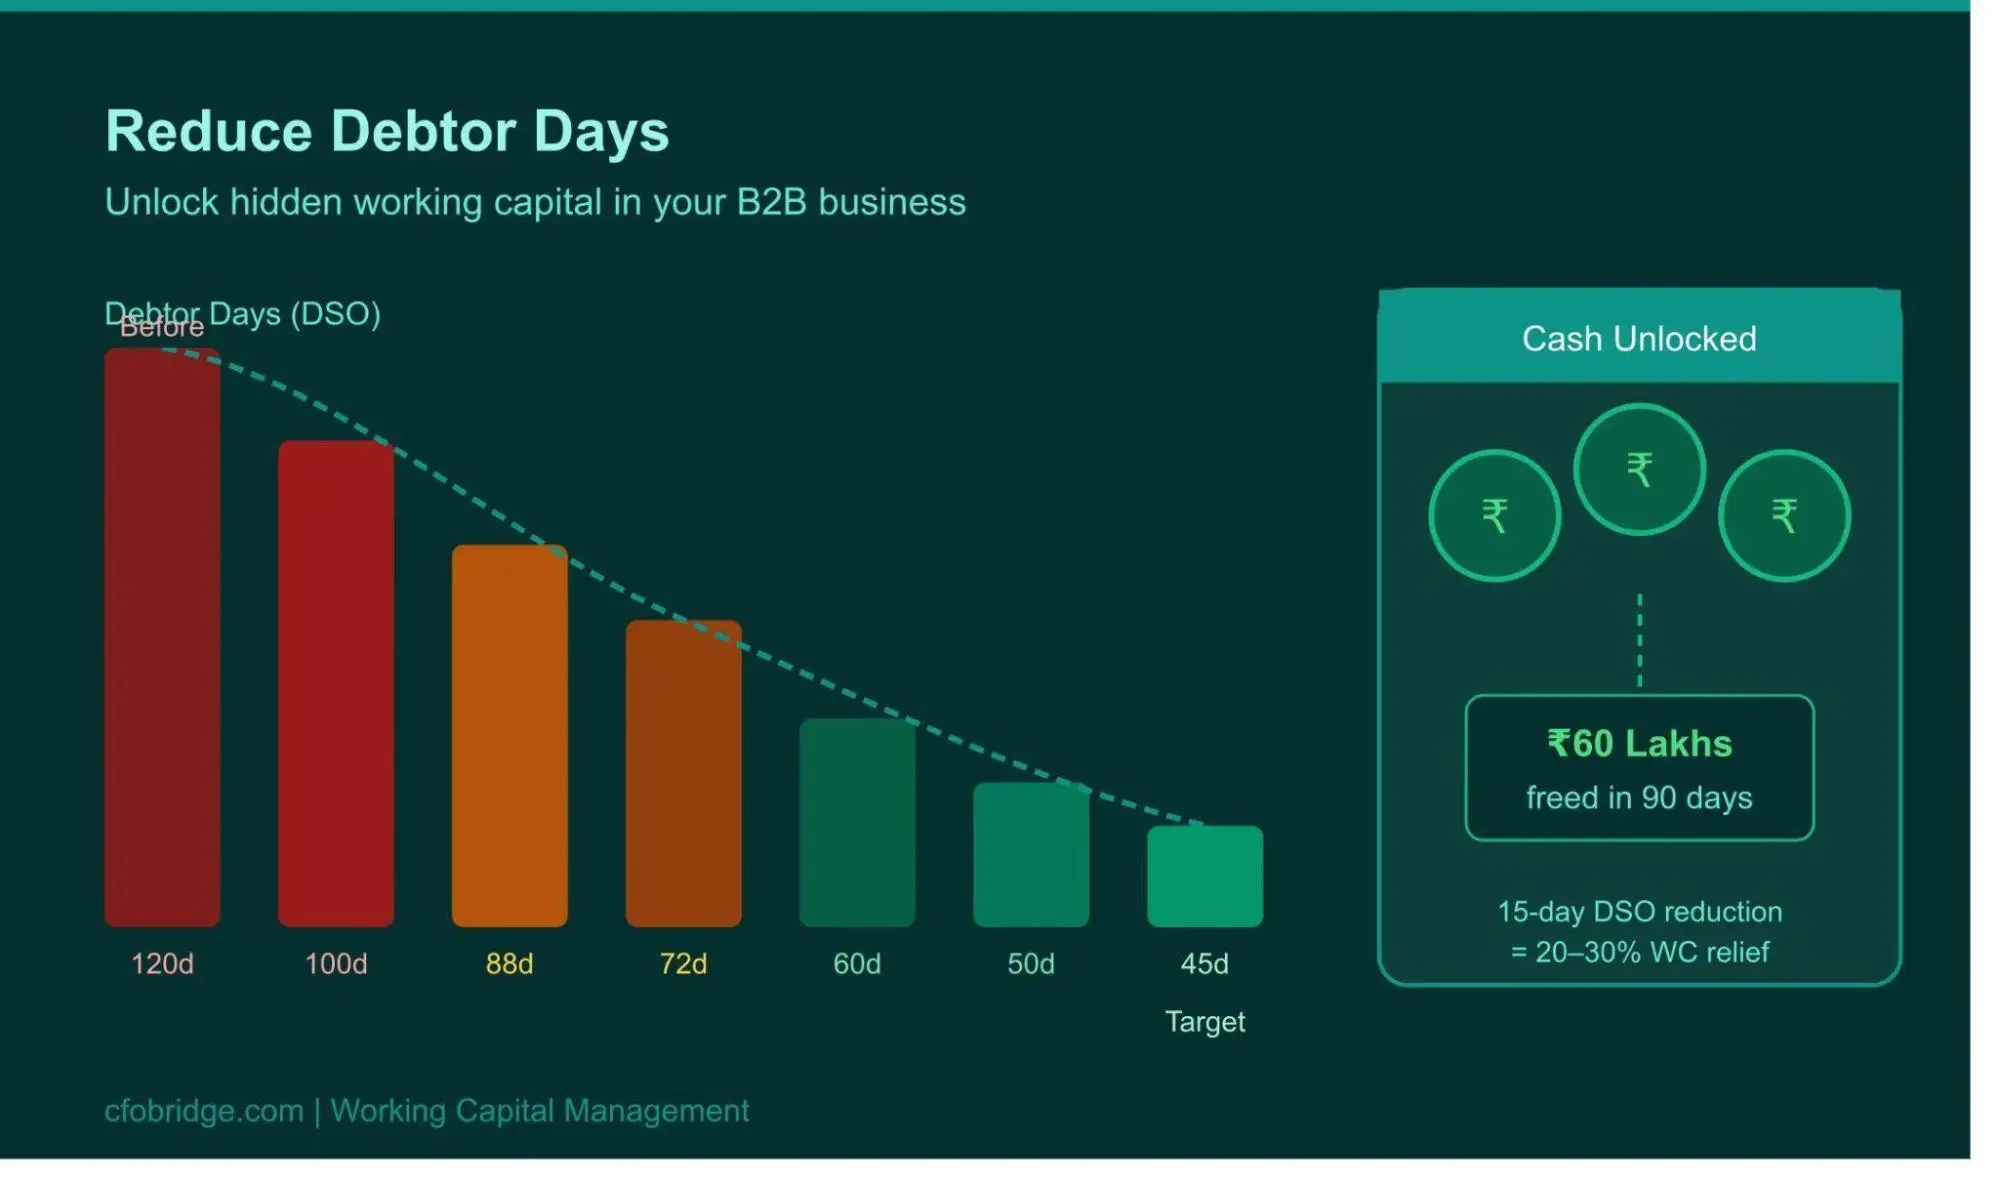
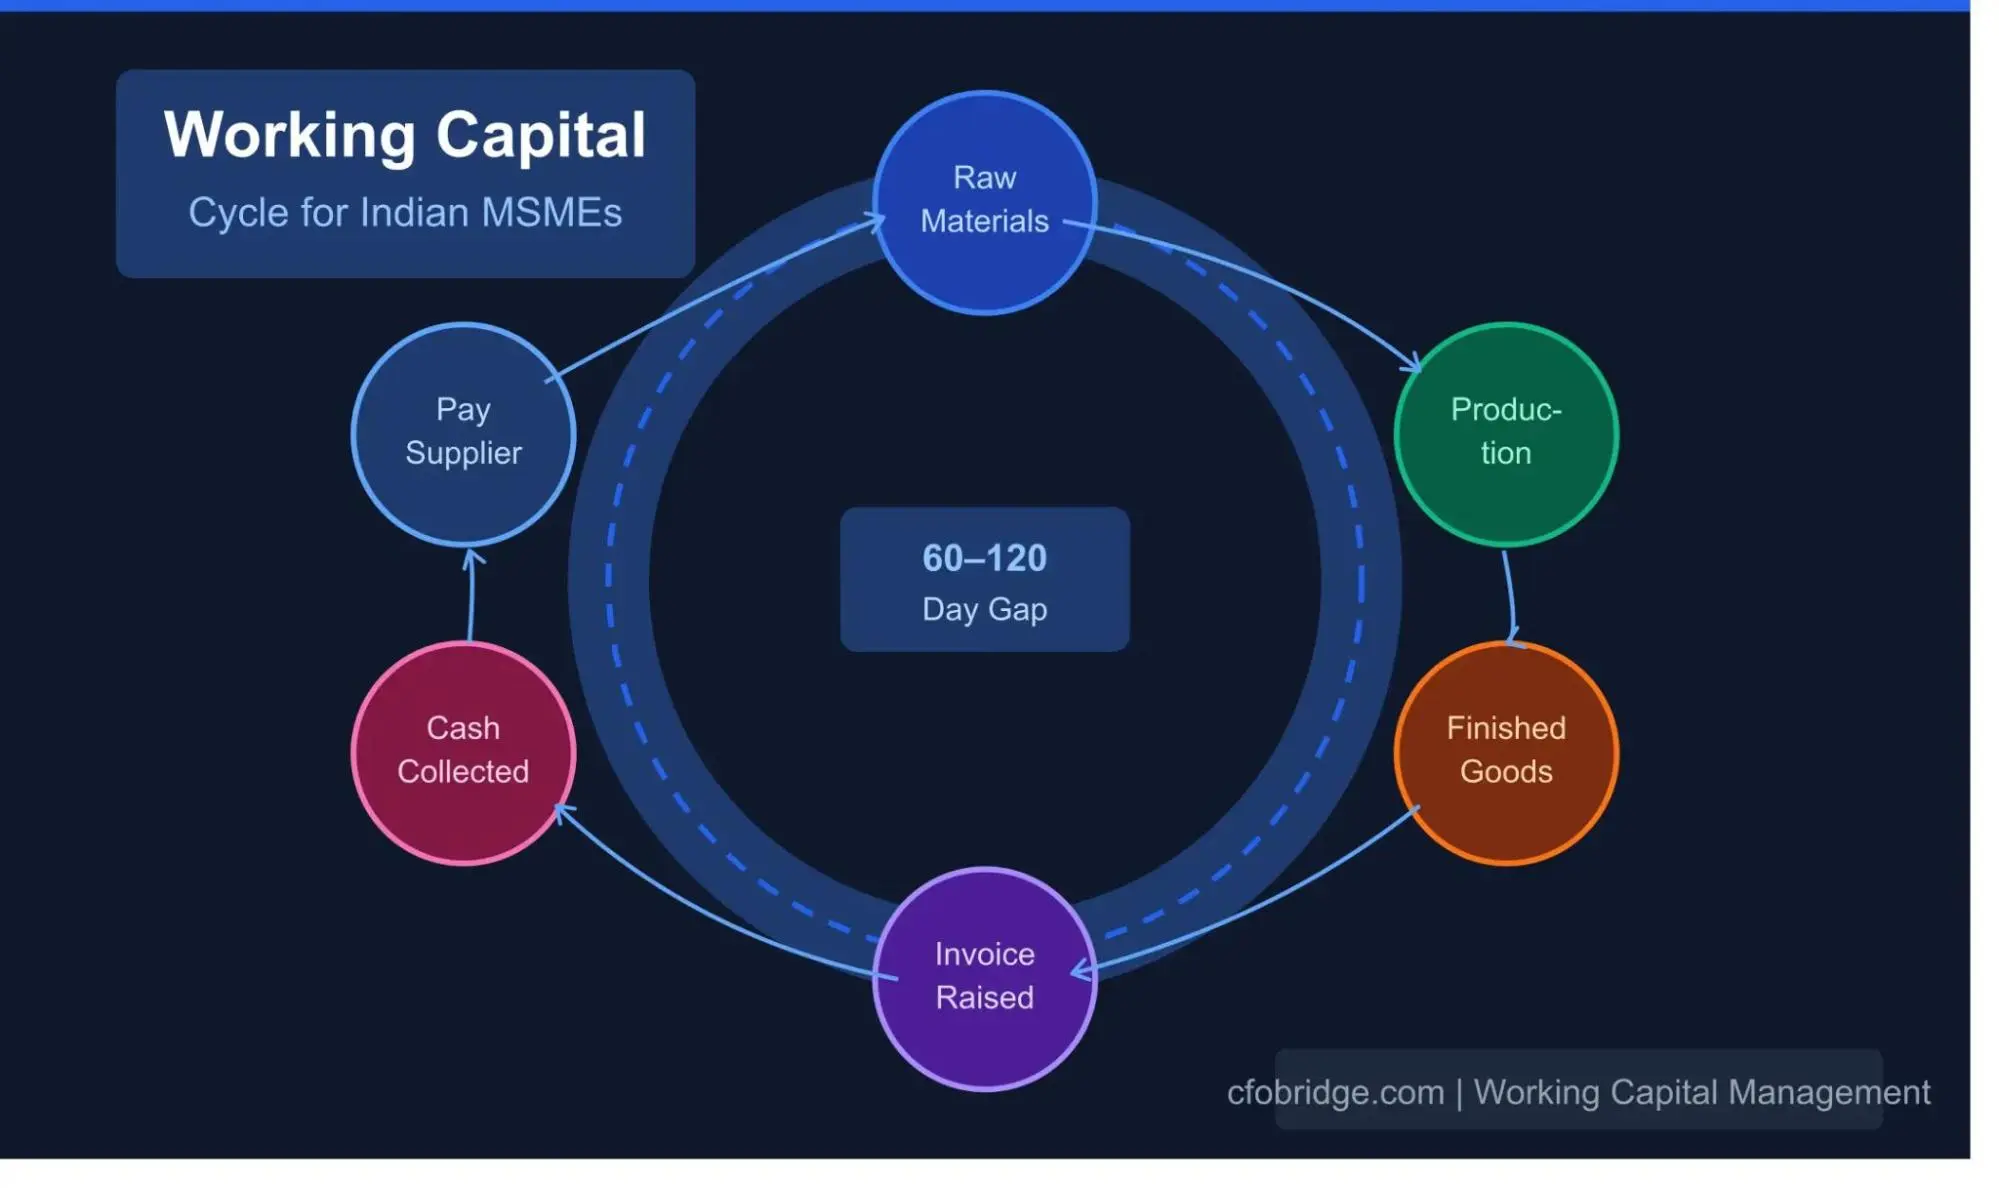
This is a common area where businesses underperform: it is not only the level of earnings that matters, but also the capital required to generate them. Working capital management is one of the most direct levers here—freeing tied-up capital without adding cost improves capital turnover and lifts ROIC.
You can improve capital efficiency by:
Increasing revenue without adding proportional capital
Making better use of existing assets
Reducing idle or underutilized resources
Avoiding unnecessary capital investments
The goal is simple: generate more output from the same capital base.
If margins improve but capital keeps increasing, your returns stay flat. If capital is optimized but margins are weak, the impact is limited. ROIC improves when both sides move together—better profitability and better capital discipline.
ROIC gives you a clearer way to evaluate your business, not just by how much profit you generate, but by how efficiently you use capital to generate it.
That shift matters. Because growth without capital discipline can look strong on paper, while quietly reducing returns over time. This is where businesses often need a more structured financial view. Not just tracking metrics, but understanding what’s driving them—and where adjustments are needed. The right FP&A framework makes this analysis systematic, not reactive.
At CFO Bridge, we work with businesses to bring that clarity:
We assess your current financial performance and identify gaps in capital efficiency
We break down what’s driving your ROIC—margins, capital usage, or both
We help align your financial strategy to improve returns without unnecessary capital strain
If you’re looking to understand whether your business is truly creating value or where your capital is underperforming, this is where the right financial insight makes a difference. Our team can help you evaluate and improve your ROIC with a practical, business-focused approach.
A good ROIC is one that exceeds your cost of capital. This indicates your business is generating returns above its funding cost and creating value. Tracking ROIC alongside other financial KPIs gives a more complete picture of performance.
ROIC includes both debt and equity, giving a complete view of performance. ROE only considers equity and can be inflated by higher leverage.
Yes. If a business uses excessive capital to generate profit, returns may look strong, but capital efficiency remains low, reducing overall ROIC. This is a common gap that working capital management strategies are designed to address.
ROIC should be tracked regularly—quarterly or annually—to monitor trends, assess capital efficiency, and support long-term financial and investment decisions.
Focus on improving margins and reducing unnecessary capital usage. Even small gains in efficiency or cost control can significantly improve overall returns. Understanding your unit economics is a strong starting point for identifying where capital is being deployed least efficiently.

Answer a few questions and get matched with experts who’ve helped 500+ businesses like yours.
CEO Description
Here's a curated list of finance leaders for your industry and company size.
Finding your perfect CFO partners...


Our talented team will reach you out shortly.
Let's talk! Book your free consultation today